![]() : favouroguntebi@gmail.com
: favouroguntebi@gmail.com

Project Explained – How Can Cyclistic Navigate Speedy Success
This blog explores the thought and work process involved in helping me analyze Cyclistic’s Business offering and unique opportunities.
Data Analysis Pipeline For The Project
Ask – Prepare – Process – Analyze – Share – Act
Business Scenario
I am a junior data analyst working on the marketing analyst team at Cyclistic, a bike-share company in Chicago. The director of marketing believes the company’s future success depends on maximizing the number of annual memberships.
Therefore, my team wants to understand how casual riders and annual members use Cyclistic bikes differently. (Probably identify distinguishing behaviors)
From these insights, your team will design a new marketing strategy to convert casual riders into annual members. But first, Cyclistic executives must approve your recommendations, so they must be backed up with compelling data insights and professional data visualizations.
Cyclistic Background
In 2016, Cyclistic launched a successful bike-share offering. Since then, the program has grown to a fleet of 5,824 bicycles that are geo-tracked and locked into a network of 692 stations across Chicago. The bikes can be unlocked from one station and returned to any other station in the system at any time.
Until now, Cyclistic’s marketing strategy relied on building general awareness and appealing to broad consumer segments. One approach that helped make these things possible was the flexibility of its pricing plans: single-ride passes, full-day passes, and annual memberships. Customers who purchase single-ride or full-day passes are referred to as casual riders. Customers who purchase annual memberships are Cyclistic members.
Cyclistic’s finance analysts have concluded that annual members are much more profitable than casual riders. Although the pricing flexibility helps Cyclistic attract more customers, Moreno believes that maximizing the number of annual members will be key to future growth.
Instead of creating a marketing campaign that targets all new customers, Moreno believes there is a very good chance to convert casual riders into members. She notes that casual riders are already aware of the Cyclistic program and have chosen Cyclistic for their mobility needs.
Stakeholders For The Project
Cyclistic
A bike-share program that features more than 5,800 bicycles and 600 docking stations. Cyclistic sets itself apart by also offering reclining bikes, hand tricycles, and cargo bikes, making bike-share more inclusive to people with disabilities and riders who can’t use a standard two-wheeled bike.
The majority of riders opt for traditional bikes; about 8% of riders use the assistive options. Cyclistic users are more likely to ride for leisure, but about 30% use bikes to commute to work each day.
Lily Moreno
The director of marketing and your manager. Moreno is responsible for the development of campaigns and initiatives to promote the bike-share program. These may include email, social media, and other channels.
Cyclistic Marketing and Analytics Team
A team of data analysts who are responsible for collecting, analyzing, and reporting data that helps guide Cyclistic marketing strategy. You joined this team six months ago and have been busy learning about Cyclistic’s mission and business goals—as well as how you, as a junior data analyst, can help Cyclistic achieve them.
Cyclistic Executive Team
The notoriously detail-oriented executive team will decide whether to approve the recommended marketing program.
The Business Goal
Moreno wants the marketing team (Me – an analyst included) to design marketing strategies aimed at converting casual riders into annual members. To do that, however, the team needs to better understand how annual members and casual riders differ, why casual riders would buy a membership, and how digital media could affect their marketing tactics. Moreno and her team are interested in analyzing the Cyclistic historical bike trip data to identify trends.
The overarching questions that my report must answer are:
- How do annual members and casual riders use Cyclistic bikes differently?
- Why would casual riders buy Cyclistic annual memberships?
- How can Cyclistic use digital media to influence casual riders to become members?
As an analyst, Moreno has tasked me with answering the first question – How do annual members and casual riders use Cyclistic bikes differently?
Ask Phase
Guiding questions
What Is The Problem I Am Trying To Solve?
I need to discover vacuums that let me convert causal riders to members (who subscribe to Cyclistic’s services. To contribute to solving this business problem, I have been tasked with analyzing the customer behaviors of casual and annual Cyclistic customers.
How Can Your Insights Drive Business Decisions?
By providing the marketing teams with detailed, well-analyzed, and understandable information about how casual and annual members differ, I can offer them a detailed overview of:
- The buying behaviors of both customer classes and why either of them opted for their chosen patronizing option
- Reasons why casual buyers have chosen to remain casual for that long
- Uncover hidden benefits members may enjoy over casual riders
- The insights I provide can also offer the marketing teams insights into communication channels and how they influence buying decisions
Key Tasks
Identify The Business Goal
The business task here is to convert casual riders to members. To do this, the marketing team understands how annual members and casual riders differ, why casual riders would buy a membership, and how digital media could affect their marketing tactics.
Consider Key Stakeholders
The key stakeholders for this project are the Cyclistic company, Lily Moreno (marketing manager), the marketing and analytics team (doing the bulk of the analysis), and the executive team.
The Deliverable
The deliverable here is to prepare a properly cleaned bill of information showcasing the differences between annual and casual members.
Prepare
Guiding questions
Where is your data located?
The data for the analysis was stored in a secured site that was regularly updated with each coming year.
How is the data organized?
The data was organized in a Microsoft Excel file and I have formatted the document, placing them in a table.
Are there issues with bias or credibility in this data? Does your data ROCCC?
I do not find any issues with the data as I found the data relevant as it was provided in Feb. 2024, the data is original as it was specifically collected for this purpose, the data is comprehensive as it contains all the required parameters, the data is citable as I can directly reference its source, and the data is current as it is properly updated regularly.
How are you addressing licensing, privacy, security, and accessibility?
The data source provides accurate information to verify the licensing, privacy, security, and accessibility.
How did you verify the data’s integrity?
I verified the data integrity by understanding its source, removing errors, and removing duplicate values.
How does it help you answer your question?
The data provided offers me the information I need to analyze customer relationships.
Are there any problems with the data?
The main problems with the data included duplicates, errors, and mixed values contributing to general inconsistencies.
Key tasks
- Check the data for errors.
- Choose your tools.
- Transform the data so you can work with it effectively.
- Document the cleaning process.
Deliverable
- Documentation of any cleaning or manipulation of data
- Analyze casual and Bikeshare member behaviors to understand their approach to using the service
- Provide insights on how Cyclistic can convert casual riders to regular members
Process
Guiding questions
What tools am I choosing and why?
I am choosing to work with Microsoft Excel, SQL, and R Programming.
Have you ensured your data’s integrity?
To ensure data integrity in this project, I will examine the data to filter out duplicates, I formatted the data as a table and used the filter for each column to ascertain data consistency, I also ensured that each column was represented with the right data type, and I inspected each column, outlining how they play into the grand scheme of the analytics process.
What steps have you taken to ensure that your data is clean?
While cleaning this data, I have sought to filter out duplicates, format each column with the right data property, and remove empty rows.
How can you verify that your data is clean and ready for analysis?
Verifying my data and making it ready for analysis includes: checking for missing values, examining data consistency, exploring outliers, validating the data types for each column, checking for duplicates, checking summary statistics, and performing data quality tests (With Power Query).
The Excel Work Process.
- After downloading the trip data from December 2020 – January 2021 in CSV format, I imported and cleaned them individually in Microsoft Excel. First by filtering and deleting duplicate values in ride_id.
- Removing duplicates from the 12-month dataset
- Cleared out blank rows that may interfere with data integrity – start_station_name, end_station_name, start_station_id, and end_station_id were also deleted.
- Changed data types into sql-compliant formats.
Analyze
Guiding Questions
How should you organize your data to perform analysis on it?
It is best to adjust the data type for each column and check for outliers in the data. To do this, I’ll import the data into Power Query to have a feel of the data.
Was the data been properly formatted?
Yes, I have properly formatted the data by ensuring all of the data conforms to the required parameters for accurate analysis,
Key tasks
- Aggregate your data so it’s useful and accessible.
- Organize and format your data.
- Perform calculations.
- Identify trends and relationships
Deliverable
- A summary of your analysis
Data Transformation and Explorative Analysis
Create a table to house the BikeShare data to be imported into MySQL
I have divided the Bikeshare table into two categories – Bikeshare data (focused on duration data) and location data (focused on location data). The dataset for this analysis is 12-months worth, extending from May 2020 to April 2021.
Duration data…
CREATE TABLE september_2020_bikeshare
(rider_id VARCHAR(50) NOT NULL,
Membership_type VARCHAR (50) NOT NULL,
Bike_type VARCHAR (50) NOT NULL,
start_time_stamp datetime NOT NULL,
start_date date NOT NULL,
start_time time NOT NULL,
start_day VARCHAR (50) NOT NULL,
start_month VARCHAR (50) NOT NULL,
return_time_stamp datetime NOT NULL,
return_date date NOT NULL,
return_time time NOT NULL,
return_day VARCHAR (50) NOT NULL,
return_month VARCHAR (50) NOT NULL,
duration INT);
Location data…
CREATE TABLE april_2021_Location (
rider_id VARCHAR (50) NOT NULL,
bike_type VARCHAR(50) NOT NULL,
start_station_name VARCHAR(100),
start_station_id VARCHAR (50),
end_station_name VARCHAR(100),
end_station_id VARCHAR (50),
start_lat DECIMAL(10, 8) NOT NULL,
start_lng DECIMAL(11, 8) NOT NULL,
end_lat DECIMAL(10, 8) NOT NULL,
end_lng DECIMAL(12, 8) NOT NULL,
membership_type VARCHAR(50) NOT NULL,
duration INT NOT NULL);
Import the data into MySQL Workbench…
LOAD DATA INFILE ‘April_2021_Location.csv’ INTO TABLE april_2021_location
FIELDS TERMINATED BY ‘,’
IGNORE 1 LINES;
The analysis process for this SQL duration dataset
First, we must combine all 12 months of data, from May 2020 to April 2021.
CREATE TABLE bikeshare_project_trips AS (
SELECT *
FROM bikeshare_project.may_2020_bikeshare
UNION DISTINCT ( SELECT *
FROM bikeshare_project.june_2020_bikeshare)
UNION DISTINCT ( SELECT *
FROM bikeshare_project.july_2020_bikeshare)
UNION DISTINCT ( SELECT *
FROM bikeshare_project.august_2020_bikeshare)
UNION DISTINCT ( SELECT *
FROM bikeshare_project.september_2020_bikeshare)
UNION DISTINCT ( SELECT *
FROM bikeshare_project.october_2020_bikeshare)
UNION DISTINCT ( SELECT *
FROM bikeshare_project.november_2020_bikeshare)
UNION DISTINCT ( SELECT *
FROM bikeshare_project.december_2020_bikeshare)
UNION DISTINCT ( SELECT *
FROM bikeshare_project.january_2021_bikeshare)
UNION DISTINCT ( SELECT *
FROM bikeshare_project.february_2021_bikeshare)
UNION DISTINCT ( SELECT *
FROM bikeshare_project.march_2021_bikeshare)
UNION DISTINCT ( SELECT *
FROM bikeshare_project.april_2021_bikeshare));
Now that our dataset has been combined, we can mass-check for data integrity
— Checking If Trips are within the right time frame (GENERAL DATA INTEGRITY)
SELECT
MIN(start_time_stamp) AS min_started_at,
MAX(start_time_stamp) AS max_started_at,
MIN(return_time_stamp) AS min_started_at,
MAX(return_time_stamp) AS max_ended_at
FROM bikeshare_project.bikeshare_project_trips;
— Members Average Ride Length: 14.1022
SELECT AVG(duration)
FROM bikeshare_project_trips
WHERE duration > 0
AND membership_type = ‘member’;
— Casual Average Ride Length: 21.0473
SELECT AVG(duration)
FROM bikeshare_project_trips
WHERE duration > 0
AND membership_type = ‘casual’;
— Average duration by month // members
SELECT return_month,
AVG(duration) AS member_average_ride_duration
FROM bikeshare_project_trips
WHERE membership_type = ‘member’
GROUP BY return_month
ORDER BY return_month;
— Average duration by month // casual
SELECT return_month,
AVG(duration) AS member_average_ride_duration
FROM bikeshare_project_trips
WHERE membership_type = ‘casual’
GROUP BY return_month
ORDER BY return_month;
— Checking for surprise values in the data
SELECT
DISTINCT
bike_type,
membership_type
FROM bikeshare_project.bikeshare_project_trips;
— Aggregate the total ride number for both members and casuals.
Casual riders were – 877,824
Cyclistic Members were – 1,253,752
SELECT COUNT(membership_type)
FROM bikeshare_project.bikeshare_project_trips
WHERE (membership_type=’casual’ OR membership_type=’member’)
AND ( (return_date BETWEEN ‘2020-05-01’ AND ‘2020-05-31’) OR
(return_date BETWEEN ‘2020-06-01’ AND ‘2020-06-31’) OR
(return_date BETWEEN ‘2020-07-01’ AND ‘2020-07-31’) OR
(return_date BETWEEN ‘2020-08-01’ AND ‘2020-08-31’) OR
(return_date BETWEEN ‘2020-09-01’ AND ‘2020-09-31’) OR
(return_date BETWEEN ‘2020-10-01’ AND ‘2020-10-31’) OR
(return_date BETWEEN ‘2020-11-01’ AND ‘2020-11-31’) OR
(return_date BETWEEN ‘2020-12-01’ AND ‘2020-12-31’) OR
(return_date BETWEEN ‘2021-01-01’ AND ‘2021-01-31’) OR
(return_date BETWEEN ‘2021-02-01’ AND ‘2021-02-31’) OR
(return_date BETWEEN ‘2021-03-01’ AND ‘2021-03-31’) OR
(return_date BETWEEN ‘2021-04-01’ AND ‘2021-04-31’))
GROUP BY
membership_type;
– What sort of bikes do bikeshare customers use?
SELECT
DISTINCT(bike_type)
FROM bikeshare_project.bikeshare_project_trips;
— Members vs Casual Bikeshare Riders Comparison over the 12 months data of our data collection cycle – May 2020 to April 2021.
— Members
SELECT COUNT(membership_type)
FROM bikeshare_project.bikeshare_project_trips
WHERE Membership_Type=‘member’
AND return_month=’__’;
— Casual
SELECT COUNT(membership_type)
FROM bikeshare_project.bikeshare_project_trips
WHERE Membership_Type=‘casual’
AND return_month=’__’;
— After obtaining comparison data, we need to create a table to view this data better…
CREATE TABLE MONTHLY_MEMBERSHIP_MEMBERS_VS_CASUAL (
MONTH VARCHAR(50),
MEMBERS_RIDE INT,
CASUAL_RIDE INT);
ALTER TABLE monthly_membership_members_vs_casual
ADD YEAR INT;
INSERT INTO monthly_membership_members_vs_casual
Values (‘May’, 113170, 85693, 2020),
(‘June’, 186863, 151602, 2020),
(‘July’, 280122, 260582, 2020),
(‘August’, 294828, 256562, 2020),
(‘September’, 282920, 211640, 2020),
(‘October’, 242893, 144685, 2020),
(‘November’, 171191, 88029, 2020),
(‘December’, 100978, 29829, 2020),
(‘January’, 78566, 17996, 2021),
(‘February’, 39355, 10004, 2021),
(‘March’, 144449, 84012, 2021),
(‘April’, 200606, 136550, 2021);
— Which Day of the week had the most member riders – Saturday, 331,011
SELECT count(rider_id), return_day
FROM bikeshare_project.bikeshare_project_trips
WHERE membership_type=’member’
GROUP BY return_day
ORDER BY return_day;
— Which day of the week has the most casual rides – Saturday, 343,146
SELECT count(rider_id), return_day
FROM bikeshare_project.bikeshare_project_trips
WHERE membership_type=’casual’
GROUP BY return_day
ORDER BY return_day;
— Average duration (in minutes) of ride for members and casual by month
SELECT AVG(duration) as average_ride_duration,
return_month
FROM bikeshare_project_new.bikeshare_project_trips
GROUP BY return_month;
|
# average_ride_duration |
return_month |
|
16.3240 18.9632 19.6232 20.2713 15.4825 17.7422 15.1415 12.4719 14.4484 14.3559 11.8513 14.1505 |
September July June May April August March December October November January February |
About Cyclistic Bikeshare Bikes.
— First the total number of bikes
SELECT count(bike_type)
FROM bikeshare_project.bikeshare_project_trips; — 3,613,089
— Number of docked_bike users
SELECT count(bike_type)
FROM bikeshare_project_new.bikeshare_project_trips
WHERE bike_type=’docked_bike’; — 2,407,052
— Number of classic_bike users
SELECT count(bike_type)
FROM bikeshare_project_new.bikeshare_project_trips
WHERE bike_type=’classic_bike’; — 534,032
— Number of electric_bike users
SELECT count(bike_type)
FROM bikeshare_project_new.bikeshare_project_trips
WHERE bike_type=’electric_bike’; — 672,005
Now, let’s figure out how members and casual cyclistic customers use these bikes…
— Number of docked_bike users // Members
SELECT count(bike_type)
FROM bikeshare_project.bikeshare_project_trips
WHERE bike_type=’docked_bike’
AND membership_type = ‘member’; —1,338,372
— Number of classic_bike users // Members
SELECT count(bike_type)
FROM bikeshare_project.bikeshare_project_trips
WHERE bike_type=’classic_bike’
AND membership_type = ‘member’; — 392,605
— Number of electric_bike users // Members
SELECT count(bike_type)
FROM bikeshare_project.bikeshare_project_trips
WHERE bike_type=’electric_bike’
AND membership_type = ‘member’; —403,728
— Number of docked_bike users // Casuals
SELECT count(bike_type)
FROM bikeshare_project.bikeshare_project_trips
WHERE bike_type=’docked_bike’
AND membership_type = ‘casual’; — 1,066,675
— Number of electric_bike users // Casuals
SELECT count(bike_type)
FROM bikeshare_project.bikeshare_project_trips
WHERE bike_type=’electric_bike’
AND membership_type = ‘casual’; — 267,564
— Number of classic_bike users // Casuals
SELECT count(bike_type)
FROM bikeshare_project.bikeshare_project_trips
WHERE bike_type=’classic_bike’
AND membership_type = ‘casual’; — 141,427
— Figuring out how the use of each bike type varies over months
SELECT
DATE_FORMAT(start_date, ‘%Y-%m’) AS month,
bike_type,
Membership_type,
COUNT(*) AS total_trips
FROM
bikeshare_project.bikeshare_project_trips
GROUP BY
month, membership_type, bike_type
ORDER BY
month, bike_type;
— Number of rides taken for each day of the week // members
SELECT return_day,
COUNT(*) AS ride_taken_by_members
FROM bikeshare_project_trips
WHERE duration > 0
AND duration < 59
AND membership_type = ‘member’
GROUP BY return_day;
— Number of rides taken for each day of the week // casual
SELECT return_day,
COUNT(*) AS ride_taken_by_members
FROM bikeshare_project_trips
WHERE duration > 0
AND duration < 59
AND membership_type = ‘casual’
GROUP BY return_day;
— How many rides are taken at each hour of the day // members
SELECT start_day,
EXTRACT(hour FROM start_time) AS hour,
Count(*) AS rides_taken
FROM bikeshare_project_trips
WHERE membership_type = ‘member’
AND duration > 0
AND duration < 59
GROUP BY start_day, hour
ORDER BY start_day, hour;
— How many rides are taken at each hour of the day // casuals
SELECT start_day,
EXTRACT(hour FROM start_time) AS hour,
Count(*) AS rides_taken
FROM bikeshare_project_trips
WHERE membership_type = ‘casual’
AND duration > 0
AND duration < 59
GROUP BY start_day, hour
ORDER BY start_day, hour;
— Do Members and casuals ride different bike types // members
SELECT bike_type,
COUNT(*) AS member_rides
FROM bikeshare_project_trips
WHERE duration > 0
AND duration < 59
AND membership_type = ‘member’
GROUP BY bike_type;
— Do Members and casuals ride different bike types // casual
SELECT bike_type,
COUNT(*) AS member_rides
FROM bikeshare_project_trips
WHERE duration > 0
AND duration < 59
AND membership_type = ‘casual’
GROUP BY bike_type;
Before we complete our SQL exploration, let’s figure out how members and casuals behave using the location data…
– – We need to add deductive columns to help us understand the location data better, before that, let’s perform some integrity checks on the location data.
— Checking long/lat coordinates
SELECT *
FROM bikeshare_project.bikeshare_project_locations
WHERE (end_lat = 0.0 OR end_lng = 0.0 OR
start_lat = 0.0 OR start_lng = 0.0); — Every record has the appropriate valies thanks to data cleaning on excel;
— Now, let’s add some inferred metrics for analytical purposes
ALTER TABLE
bikeshare_project.bikeshare_project_locations
ADD COLUMN start_geopoint VARCHAR(50),
ADD COLUMN end_geopoint VARCHAR(50),
ADD COLUMN distance FLOAT4;
— Populating The Empty Columns
UPDATE bikeshare_project.bikeshare_project_locations
SET start_geopoint = concat(start_lat, ” , ” , start_lng),
end_geopoint = concat(end_lat, ” , ” , end_lng)
WHERE TRUE;
— Calculating the distance travelled between the geopoint (rounded)
UPDATE bikeshare_project.bikeshare_project_locations
SET
distance=round(st_distance(end_geopoint, start_geopoint))
WHERE TRUE;
— Assess the test stations — Exclude them?
SELECT
end_station_id,
end_station_name,
start_station_id,
start_station_name,
membership_type
FROM bikeshare_project.bikeshare_project_locations
WHERE
end_station_id LIKE ‘%Test%’ OR
end_station_name LIKE ‘%Test%’ OR
start_station_id LIKE ‘%Test%’ OR
start_station_name LIKE ‘%Test%’;
— Bikeshare Trips – 3,610,371 vs Bikeshare_Locations – 3,422,978 — This means over 200,000 bikeshare users did not have their location data recorded.
— What are the popular locations like for members and casuals? // members
SELECT start_station_name,
COUNT(*) AS number_of_rides
FROM bikeshare_project_locations
WHERE duration < 59
AND duration > 0
AND membership_type = ‘member’
AND start_station_name != ‘Null’
GROUP BY start_station_name
ORDER BY number_of_rides DESC; — Clark St. & Elm St. seem most popular among members
— What are the popular locations like for members and casuals? // casuals
SELECT start_station_name,
COUNT(*) AS number_of_rides
FROM bikeshare_project_locations
WHERE duration < 59
AND duration > 0
AND membership_type = ‘casual’
AND start_station_name != ‘Null’
GROUP BY start_station_name
ORDER BY number_of_rides DESC; — Streeter Dr & Grand Ave seems to be the most popular stations for casual riders.
— Most Popular End_Stations for // Members
SELECT end_station_name,
COUNT(*) AS number_of_rides
FROM bikeshare_project_locations
WHERE duration < 59
AND duration > 0
AND membership_type = ‘member’
AND start_station_name != ‘Null’
GROUP BY end_station_name
ORDER BY number_of_rides DESC; — Clark St & Elm St is the most popular end_station for members
— Most Popular End_Stations for // casuals
SELECT end_station_name,
COUNT(*) AS number_of_rides
FROM bikeshare_project_locations
WHERE duration < 59
AND duration > 0
AND membership_type = ‘casual’
AND start_station_name != ‘Null’
GROUP BY end_station_name
ORDER BY number_of_rides DESC; — Streeter Dr & Grand Ave is the most popular end_station for casuals.
The Analyze Phase – Part 2 (Power BI)
With MySQL, we’ve been able to adequately filter out irrelevant data and combined all 12 months of data into one.
We have been able to: find the average ride length, compare total rides in each month for members and casuals, aggregate the total number of bikes used by each customer type, Figure out how eeach bike use varies over the season, number of rides during every weekday for members and casuals, number of member/casual rides taken during each hour of a 24-hour day, and popular stations for members and casuals.
To take our analysis a step further, we need to visualize how different data points intersect.
To analyze Cyclistic’s data in Power BI, here are a few things I have done.
- Connected the MySQL server to Power BI.
- Selected the right data types for each column.
- Broke down a large facts table into smaller dimension tables.
- Built relationships between the facts table and dim tables with cardinality types to ensure proper communication between data points.
- Generated visualizations with intersecting data points to gather insights into customer behaviours.
- Built tooltips to help viewers interpret the visualizations.
The findings in my analysis are shown below:
July, August, and September have the most rides for most casuals and members. The rise in casual and member rides leads me to want to probe further…
Next, I investigate the seasonal response by members and casuals to Cyclistic’s services.
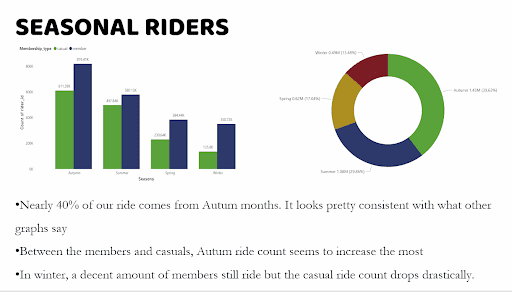
This visualization shows that the summer months experience much higher biking traffic compared to other months. The summer months rise in traffic coincides with the rising rider counts for July, August, and September in the prior visual.
The summer months in Chicago (where Bikeshare primarily operates) may witness high biking traffic because:
- It is generally warm and the residents are much more active
- It is a great month for tourists looking to explore the city a lot more
- Since residents do not have to worry about adverse weather, they may find it easier to ride in these months
Conversely, the winter months (from November to February) experience much lower bike use generally.
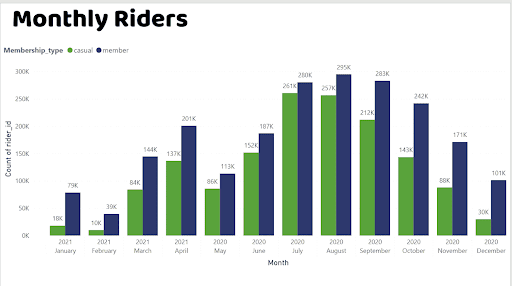
Next, let’s put some figures to the number of riders in each month.
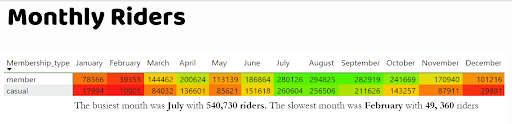
Now, let us begin to draw distinctive lines between Casual and Members attitudes toward bike use.
First, let’s see how long they comparatively use these bikes for:
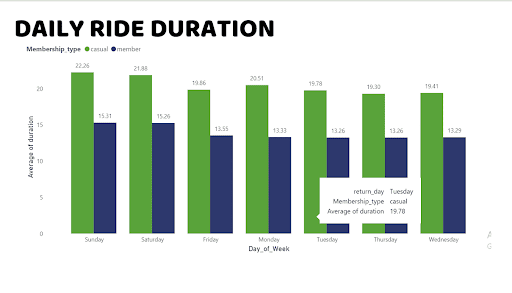
From this chart, we can see that Casuals use the bikes for much longer than Members. This could mean that members have a set routine which they work with and they have bikeshare as a part of that routine. Casuals on the other hand may seem much more spontaneous.
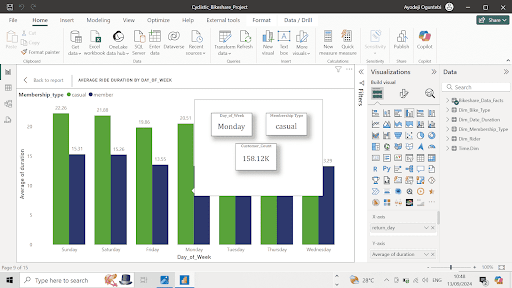
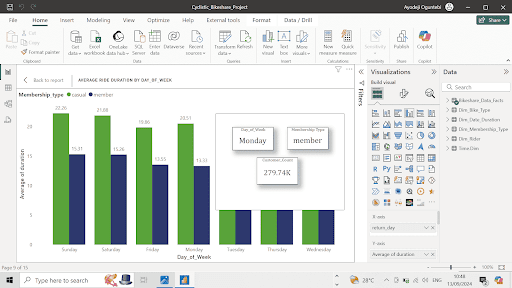
Despite riding for much longer, more members use Cyclistic during the week compared to casuals. Members may use Cyclistic’s services during the day because it coincides with their work or school.
But on weekends, the inverse occurs. Casuals use Cyclistic’s services much more than members do.
The following graphs confirm it:
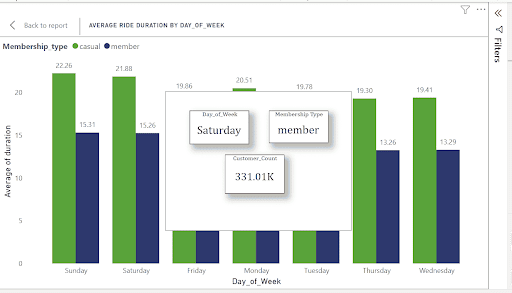
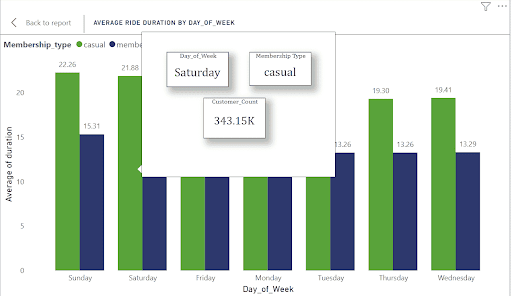
Casual using Cyclistic’s Bikesharing program more than members on weekends further reinforces the idea that members mainly use Cyclistic’s services around routine weekday activities while casuals use Bikesharing much more spontaneously.
Let’s further probe Cyclistic’s Casual and Member customer behavior through their hourly usage patterns.
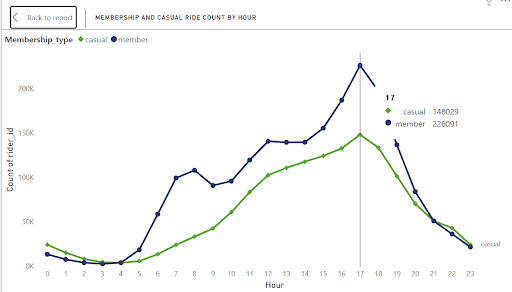
- Around 7am, the traffic with members really started to peak – this means people are using the bikes for work, school, and daily commute.
- The rides for members also started to drop by 5 pm in keeping with general work and school schedules.
- The peak for casuals starts a bit later at 9 pm. It drops at around 5 pm as well (similar) to members.
- Members and casuals have maximum bike use at 17:00 (5 pm).
To Summarize All I Have Found:

5. The Share Phase
Now, I have performed some analysis and found interesting trends. It time to share everything I found so far and importantly, to provide actionable insights for the executive team at Cyclistic Bikeshare.
To share my findings with the Cyclistic executive team, here are a few questions that have led my decisions:
Was I able to answer the question of how annual members and casual riders use Cyclistic bikes differently?
I was able to identify certain differences in how Cyclistic members and casuals use their bikes differently. They both seem to use the bikes in different aspects and for different durations.
What story does my data tell?
The data tells me a story of how customers see and use bikes.
How do my findings relate to your original question?
My findings correlate with Cyclistic’s marketing team’s mission to find marketing loopholes that they can take advantage of.
Who is your audience? What is the best way to communicate with them?
While the data has not essentially provided me with enough information regarding communication channels, the riding patterns tell me the majority of the casuals may be tourists and summer outgoers.
Can data visualization help me share my findings?
Definitely! The visualizations can help me share my findings as I can convey my findings in simple, easily understandable visuals.
Is your presentation accessible to my audience?
My presentation has been placed in a presentation software with markers and tips available to help viewers navigate different aspects of the presentation. I will also provide a much more detailed report through Power BI for viewers looking to dig deeper into my visuals and draw connecting lines between those visuals.
6. The Act Phase
True Results Come From Taking The Right Steps With The Right Insights.
What is My final conclusion based on your analysis? Converting casual riders to annual riders is possible as long as we address the main issue of our riders which is lacking flexibility in offerings for.
How could your team and business apply your insights? We can apply these insights based on the recommendations listed.
What next steps would you or your stakeholders take based on your findings? The marketing team can move forward in their decision to convert casual riders to annual members.
Is there additional data you could use to expand on your findings? Additional data could certainly help expand my findings. More data on the age group of the customers, specific information on what a complete trip means, and more purchase information. While I understand the importance of data anonymization, providing these sets of data can certainly help me provide much more detailed insights.
Can data visualization help you share your findings? Data visualization is easy to understand and it is very helpful to show findings from the analysis conducted from data.
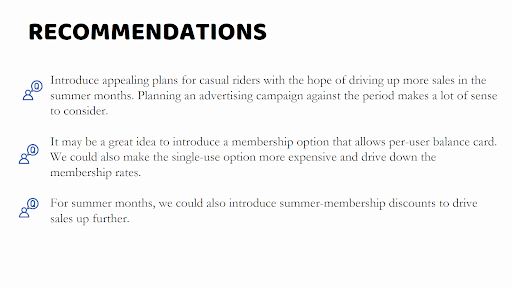
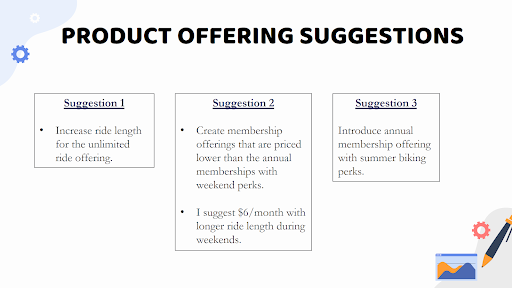
Here are some of my actionable recommendations: